Electricity Maps provides historical power mix and carbon data from 2015 onwards. Electricity Maps data can be accessed at granularities ranging from hourly to yearly.
Electricity Maps' platform continuously fetches and processes electricity data from all over the world to consistently provide complete power breakdown and carbon data in real-time.
Electricity Maps' models generate 24h ahead power breakdown and carbon intensity forecasts.

Get access to the carbon intensity (in gCO2eq/kWH) of electricity consumed in a specific region, which takes into account the life-cycle emissions of electricity production.

Get insights into the production and consumption breakdown of electricity by power source (e.g. gas, solar).

We deliver data at an hourly resolution, to reflect the variation in grid emissions throughout the day.

Using our peer-reviewed flow-tracing methodology, we accurately trace back the true origin of electricity by accounting for imports and exports.

Get access to a comprehensive database of carbon intensity and power breakdown data going back up to 5 years depending on the region. Electricity Maps provides historical data at granularities ranging from hourly to yearly depending on your needs.
We continuously validate and update our historical data to make sure you have the most accurate and up-to-date data available.
We continuously run our estimation pipeline to identify gaps and compute estimates for any missing hours. This way you can trust that we always have a value for all hours.
Get access to the real-time carbon intensity and power breakdown to engage your users, and take better informed decisions. Our real-time data platform continuously processes the most up-to-date data from our sources. Our internal estimation models further ensure completeness of our real-time data, even if some of our data sources are unavailable.
All our real-time sources provide electricity data at a subhourly frequency with less than 2 hours of delay.
Our open-source app visualizes grid data from across the world in real time. Check it out.
Our forecasts can be used to make carbon-informed decisions—both for your company and your end-users.
Our forecasts use machine learning algorithms trained on a wide array of data, such as production, price, and weather data.
Get access to forecasted carbon intensity and power breakdowns 24 hours in the future.
All our models are monitored and frequently retrained to reflect changes in the grid.

Electricity Maps offers a broad range of data including carbon intensity and the full power mix of electricity consumed in a region—all available historically, in real-time, and as forecasts.
%201.svg)
We offer data for more than 200 regions and 50+ countries worldwide. We are continuously expanding our geographical coverage, to continue providing the most comprehensive data on the world’s electricity.

With leading domain expertise and a dedicated global community of contributors, we offer the most accurate and highest-quality data. We continually work to improve data quality and ensure maximum transparency in the process through our open-source and scientific approach.
Learn more about how our clients and partners use our data, and hear what they have to say about Electricity Maps.
.png)
Driven by ambitious sustainability goals, Google’s Climate Operations team partnered with Electricity Maps to reduce its carbon footprint and enable other companies to do the same.
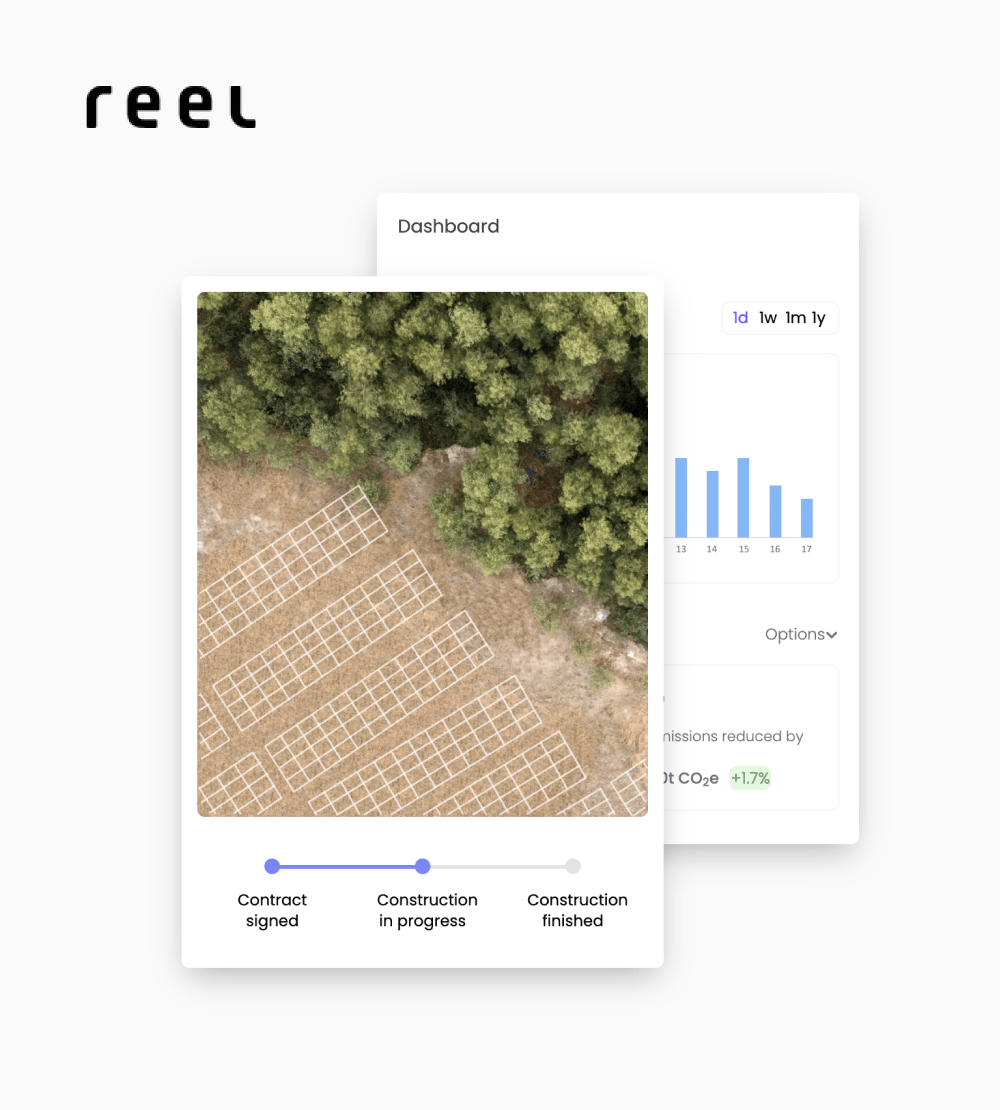
Reel transforms the procurement of sustainable energy for companies. With 24/7 data from Electricity Maps, Reel enables companies to truly take action against climate change
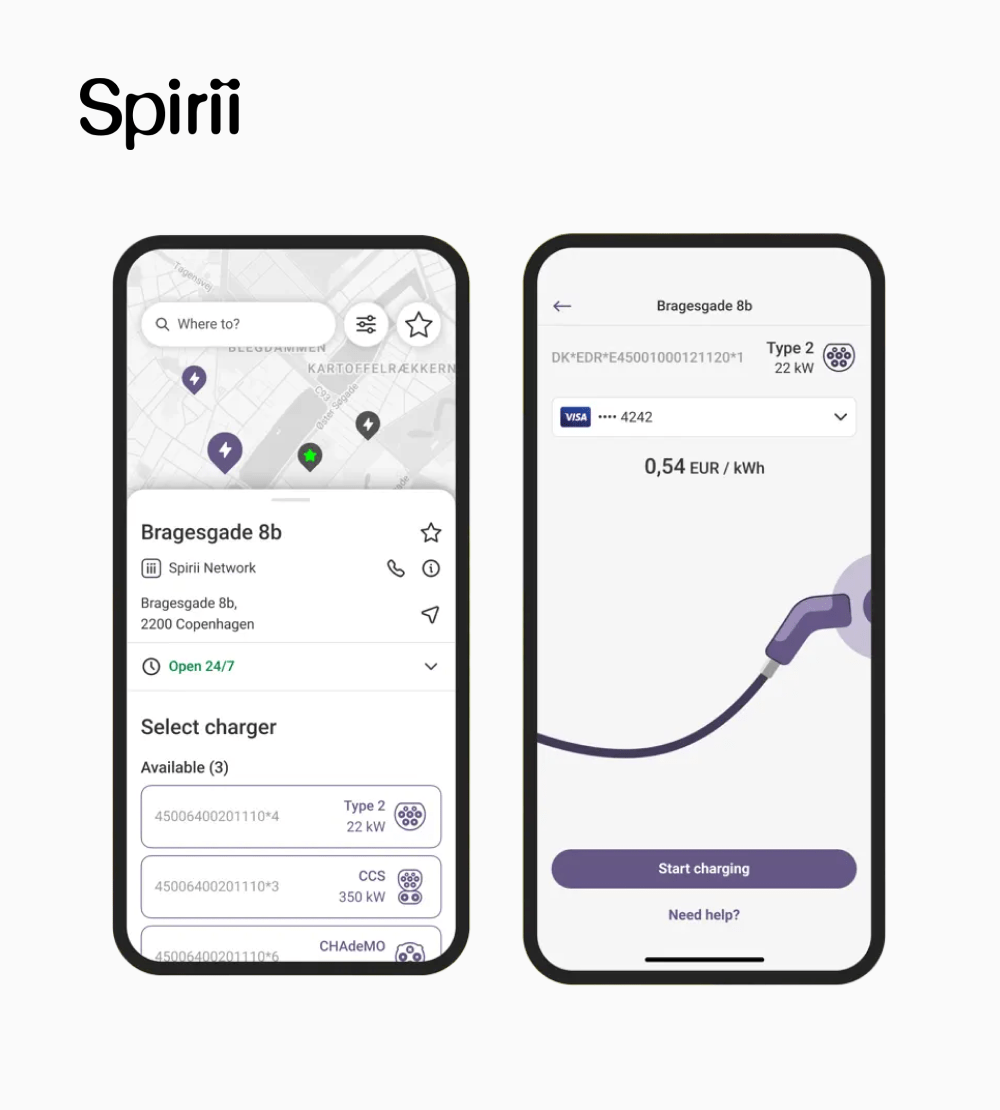
Spirii is an EV charging and business management platform that allows businesses to offer seamless charging experiences.
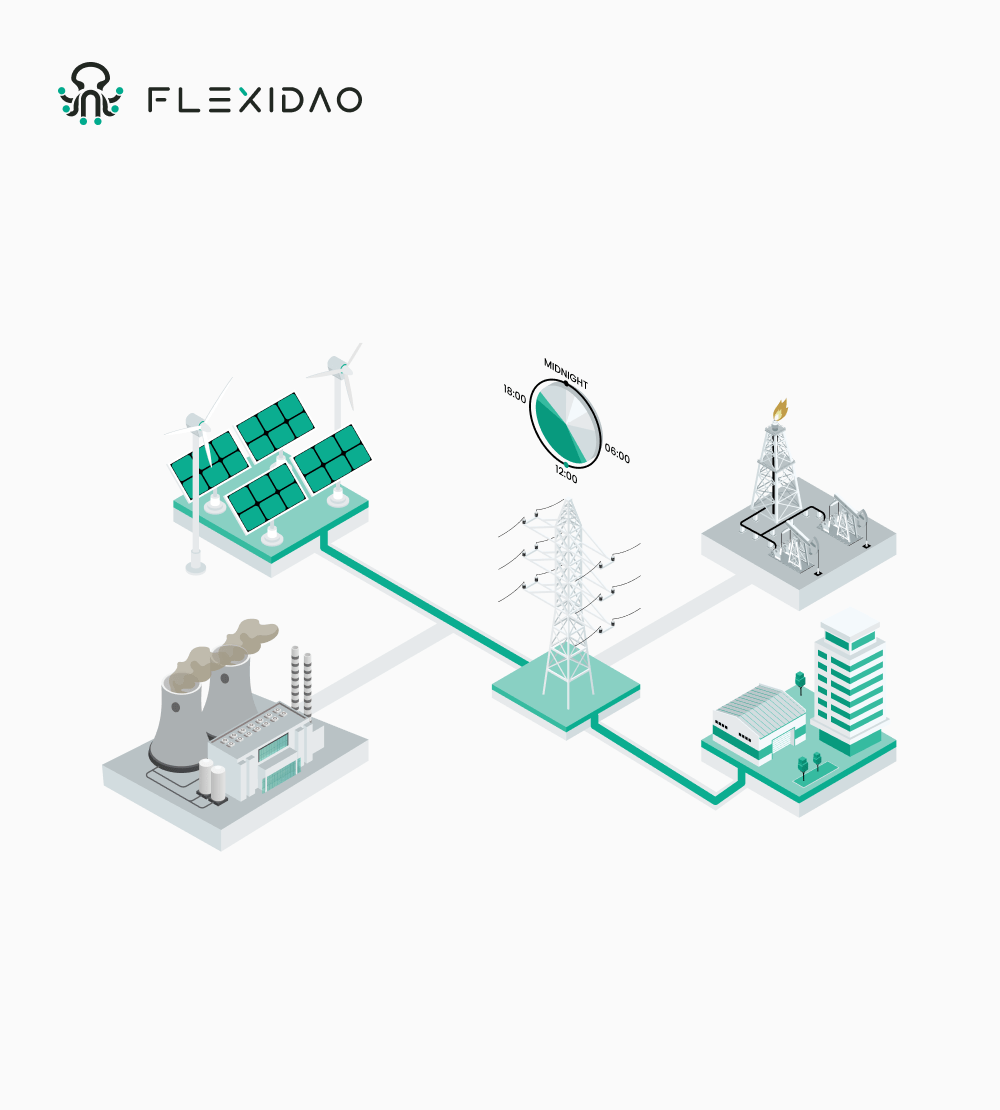
FlexiDAO supports companies, energy buyers, suppliers, and consultants in guiding them in their transition from buying yearly energy certificates to 24/7 energy matching.