
Emissions from electricity consumption decreased in 2023 compared to the two previous years and reached the pandemic levels of 2020. Unlike Europe, this was not a consequence of demand reductions but was mainly caused by the coal-to-gas transition. Although emissions decreased, the US has not yet reduced its fossil-based electricity production despite continuous investments in wind and solar generation. The US is today still dependent on fossil fuels, especially to meet sudden increases in power demand and it remains a major challenge for its grid decarbonization.
With such development speed in variable renewables production however, the US could generate more electricity from wind and solar than coal in 2024 which would be a first milestone in its long grid decarbonization journey.
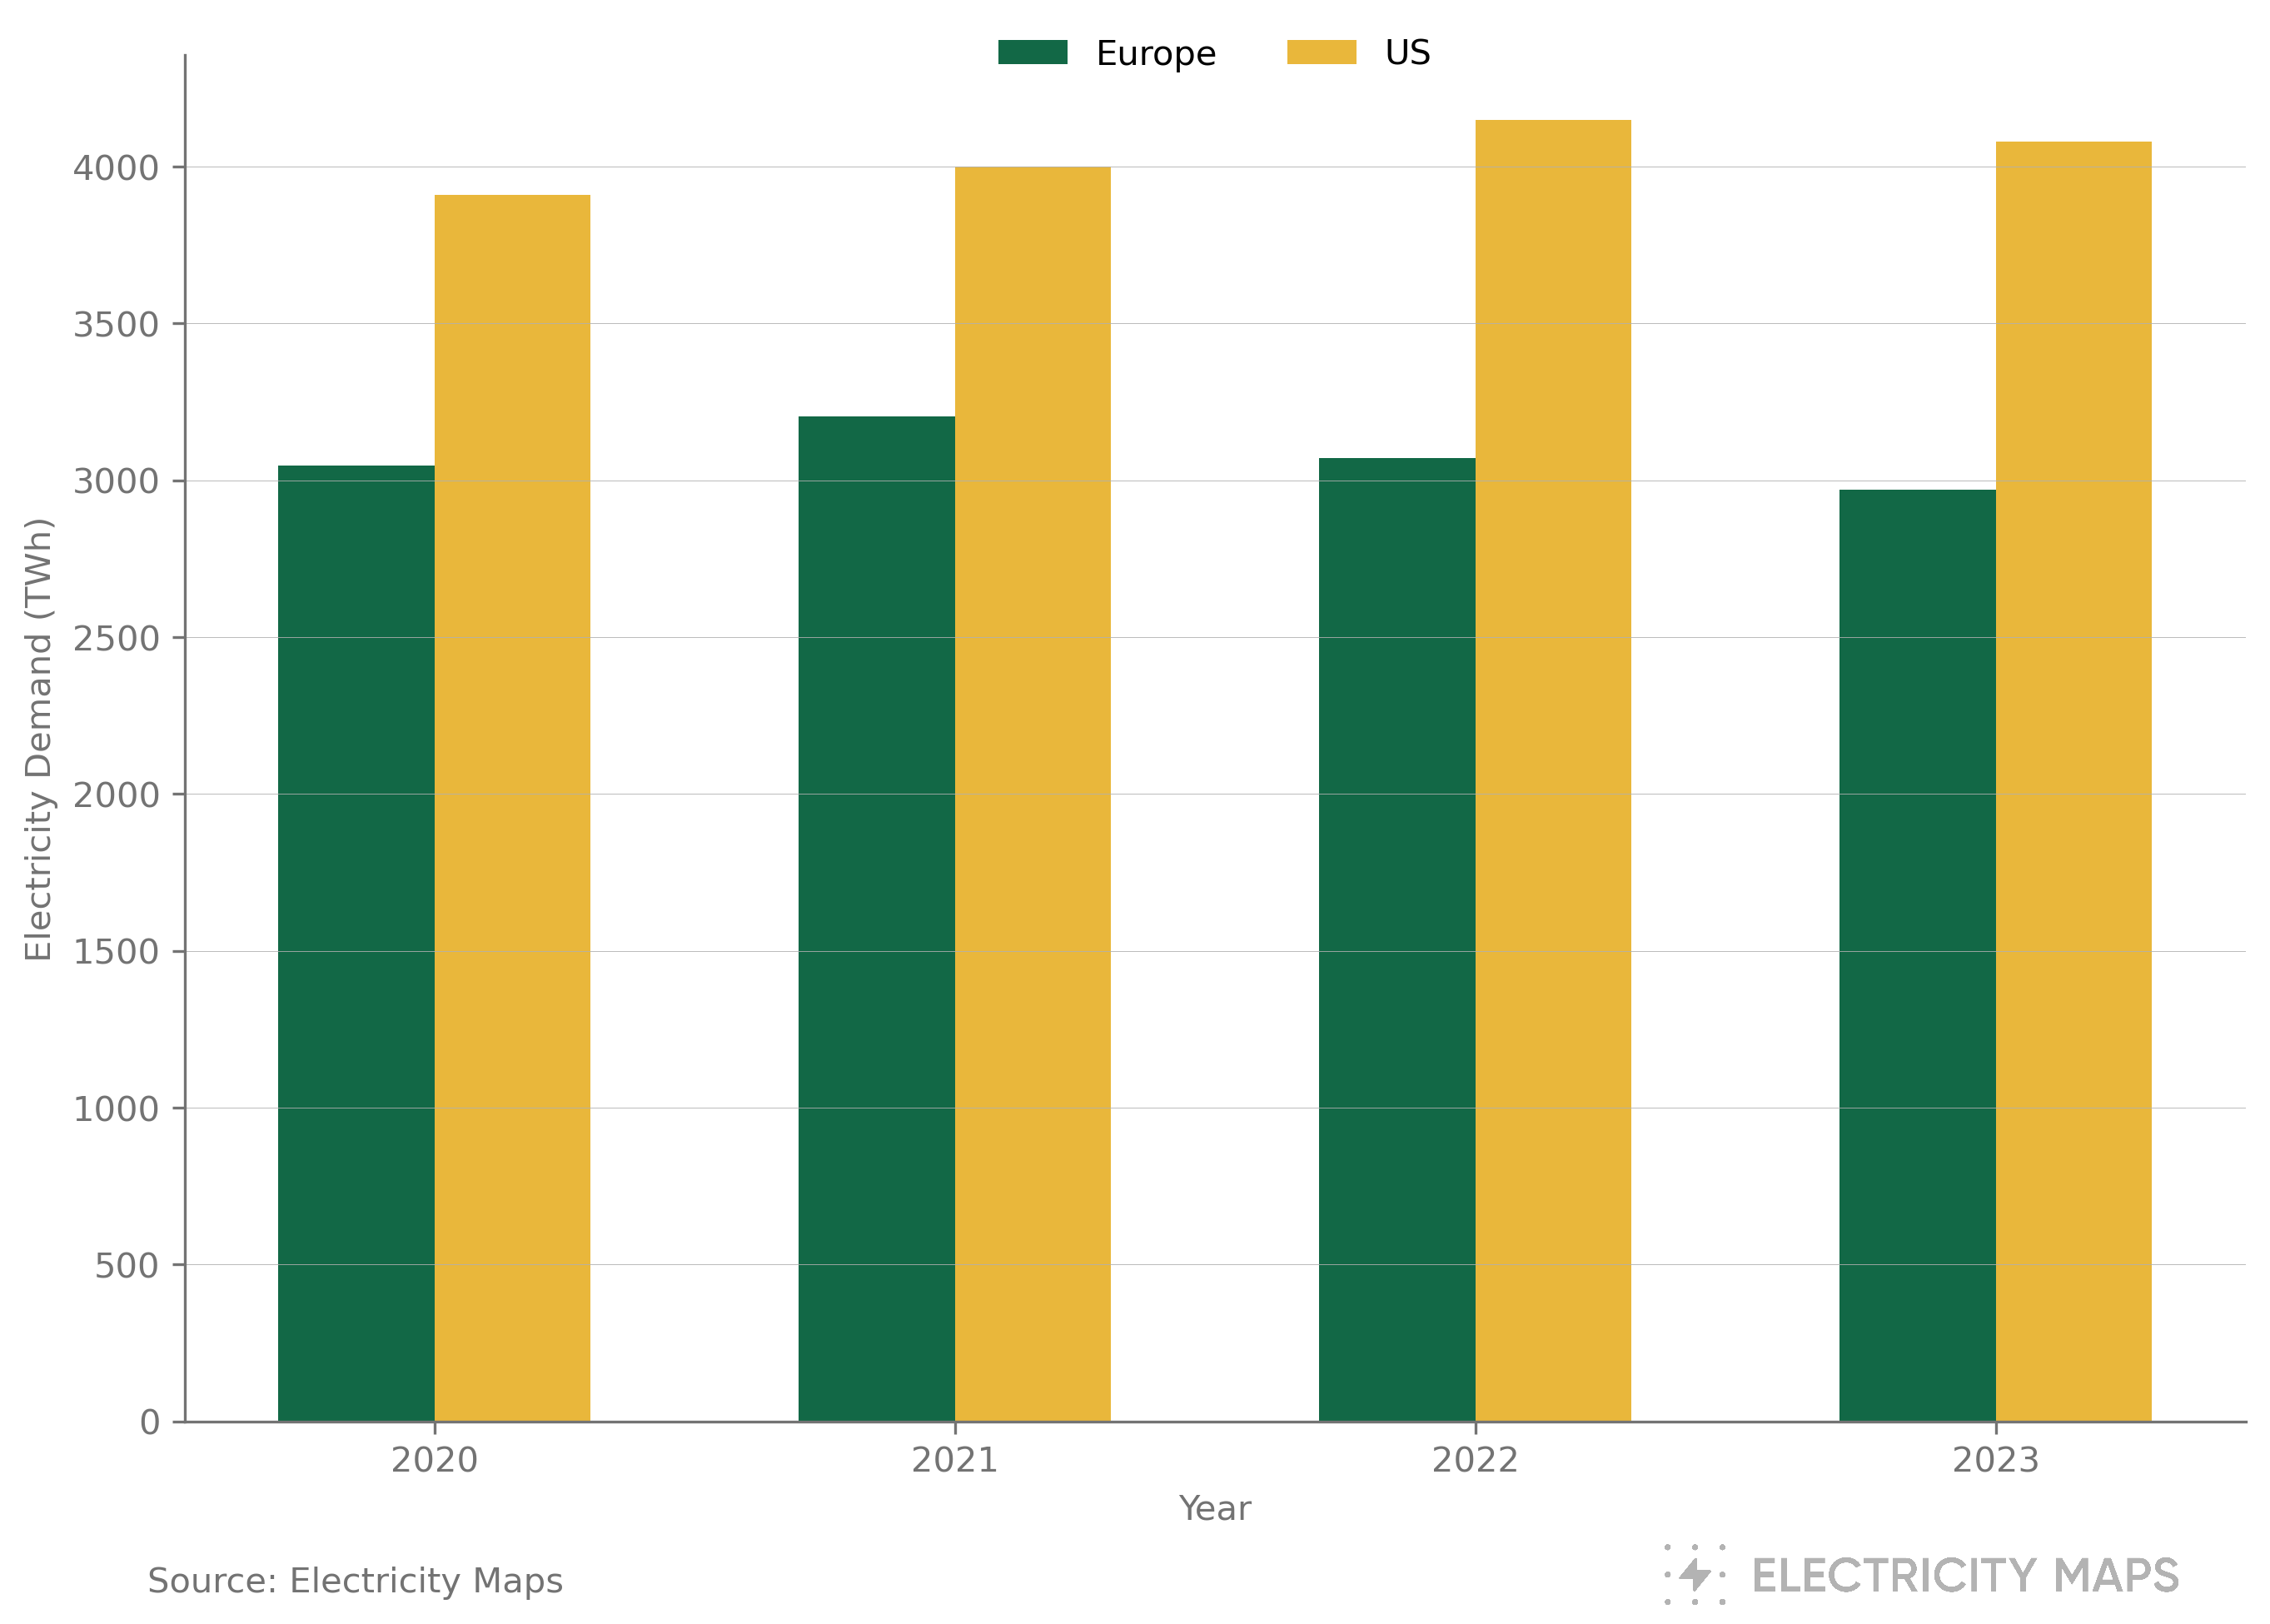
US electricity consumption decreased by nearly 2% in 2023 compared to 2022. According to the IEA1, slowing economic growth contributed to this decrease in electricity demand. The US was less impacted by the energy crisis and rising prices of natural gas and thus experienced a lighter reduction in electricity demand compared to Europe (where it decreased by 4%). Electricity demand in the US in 2023 remained above 2020 and 2021 levels.

The month-by-month comparison with 2022 highlights the impact of weather with some seasonal variation. The US experienced a mild winter at the beginning of 2023 and temperatures were also milder than in 2022 in May and June. Electricity demand thus clearly decreased in H1 2023 compared to H1 2022. On the other hand, cooling demand increased with high temperatures and heat waves in the second part of the summer and it balanced the decrease from slowing economic growth. In H2 2023, electricity demand remained overall closer to 2022 levels.

Following a trend that began several years ago, the increase in solar generation continued in 2023. It increased by 20% compared to 2022 and nearly doubled since 2020. However, despite the numerous additions in solar capacity throughout the country during recent years solar generation represented less than 4% of total electricity generation in 2023 far from gas, coal, and nuclear generation levels.
With the Inflation Reduction Act of 2022, investments in renewable energy are likely to accelerate in the US in the coming years with new subsidies and programs that will reduce renewable energy costs2.

After increasing by more than 30% between 2020 and 2022, the share of electricity generation from wind shrank slightly in 2023. An El Niño climate pattern led to lighter-than-normal wind speeds in the Midwest US, South West Great Plains, and Texas3,4 between April and June 2023. During these 3 months, electricity production from wind was reduced by more than 15% compared to 2022. However, wind still represented more than 10% of the country’s total electricity production, a share that was reached last year for the first time.

In 2023, the coal-to-gas transition that has been taking place these last years continued. Coal-fired electricity generation drastically decreased showing a near 20% reduction compared to 2022. The share of coal-fired electricity generation in total US electricity production dropped to 17% compared to almost 30% five years ago. This is a direct consequence of the retirement of more than 15 GW of coal power plant capacity in 2022. It continued in 2023 with the decommissioning of 5% of the beginning of the year’s coal-fired capacity. This retirement slightly exceeded the plans initially set5.
At the same time, almost 9 GW of natural gas power plant capacity was added to the US grid in 2023 after increasing by already 7 GW in 2022. Electricity grids are switching from coal-fired electricity generation to natural gas in the US. Some coal power plants are retired, while others are repurposed to burn alternative fuels such as natural gas. This switch is driven by stricter emission standards, low natural gas prices, and more efficient new natural gas turbine technology6. As a result, electricity generation from gas increased by 7.5% compared to 2022 and is more than ever the first power generation source in the US accounting for more than 40% of total electricity production.

If the US can boast about reducing its coal-fired electricity generation by 20% in 2023, this was only made possible by a simultaneous increase in gas generation. Today, fossil power sources are used to meet increases in electricity consumption caused by heating and cooling demand hence the seasonality observed in the above graph. In the summer of 2023, several records of peak electricity load were broken throughout the US during heatwaves and caused ramp-ups in fossil fuel-based electricity generation. With global warming, this has become a growing challenge to the decarbonization path of the US grid.
Electricity generation from fossil fuels has not decreased in the US since 2020 remaining stable despite seasonal variations and far ahead of renewables. Electricity generation from coal and gas combined still accounted for 60% of US electricity production in 2023.

Even though electricity produced from gas is known to have a lower carbon intensity than electricity produced from coal, grid decarbonization will require a massive reduction of all fossil-based generation, and the coal-to-gas transition won’t be enough to reach climate targets. Wind and solar generation are only the 4th and 6th electricity sources in the US today far behind gas, nuclear, and coal.

As a result of the coal power plants retirement happening in the US, and with the continued development of renewable energy projects, the EIA forecasts wind and solar power production to overtake coal generation for the first time in the US in 20247.
As observed in 2023, wind and solar generation remain far from coal-fired electricity production during summer when electricity demand significantly increases for cooling. The ability of the US to meet this milestone in 2024 will highly depend on the weather conditions that will be experienced during the summer. The same holds for winter when cold snaps can also cause a surge in electricity production from coal.
On the other hand, wind electricity production was challenged by low wind speeds in the US throughout spring. More favorable wind conditions in 2024 could help wind and solar exceed coal-fired electricity generation in the US. Finally, the measures introduced by the Inflation Reduction Act 2022 put the US on a better trajectory to reach this milestone8. If not reached in 2024, it will likely be achieved in the coming years.

In 2023, California kept its spot as the region with the largest power generation from solar with a total of 41 TWh, representing more than 20% of its total electricity generation. Texas is progressively closing the gap with California, with more than 30 TWh of solar electricity generated in 2023. It represents a 35% increase compared to 2022 and a 110% increase compared to 2021. However, solar electricity generation represented less than 7.5% of Texas’ total electricity production remaining far from Californian levels. Behind California and Texas, other US regions are lagging in terms of solar generation.

In terms of wind generation, three regions have steadily increased their production since 2018: Central East US (US-MIDW-MISO), Central West US (US-CENT-SWPP), and Texas. However, all three regions were impacted by the low wind speeds experienced throughout the US in 2023. Only Texas managed to increase its power generation from wind in 2023 compared to 2022. Central West US (US-CENT-SWPP) is however still leading the way with more than 35% of its electricity production sourced from the wind.

Of the major US regions, California was able to maintain the lowest carbon intensity over the year. As seen above, California is leading the way in the US in solar electricity generation but also benefits from an almost total decommissioning of coal power plants.
While all regions manage to have a carbon intensity of their electricity below 400 gCO2 eq/kWh, all of them experience an increase in carbon intensity when power consumption increases. This is particularly true in PJM Interconnection (South Atlantic) where carbon intensity and power consumption are highly correlated. This again highlights how the US power grids are today highly dependent on fossil fuels to meet increases in power demand and peak load.
The addition of renewable energy alone won’t be enough to help US regions decrease their carbon intensity below 100gCO2eq/kWh. Clean power baseload and storage will be key to enabling decarbonized electricity consumption throughout days and years. In California, great investments have been made in storage capacity to help the region cope with the increase in its solar generation and deal with the intermittency of this power source. It now benefits from almost 7 GW of installed capacity in battery storage compared to less than 1 GW four years ago9. Total electricity discharged on the grid from batteries has been greatly increasing during the last 2 years to almost reach 500 GWh of electricity discharged monthly which is close to 3% of monthly electricity demand.


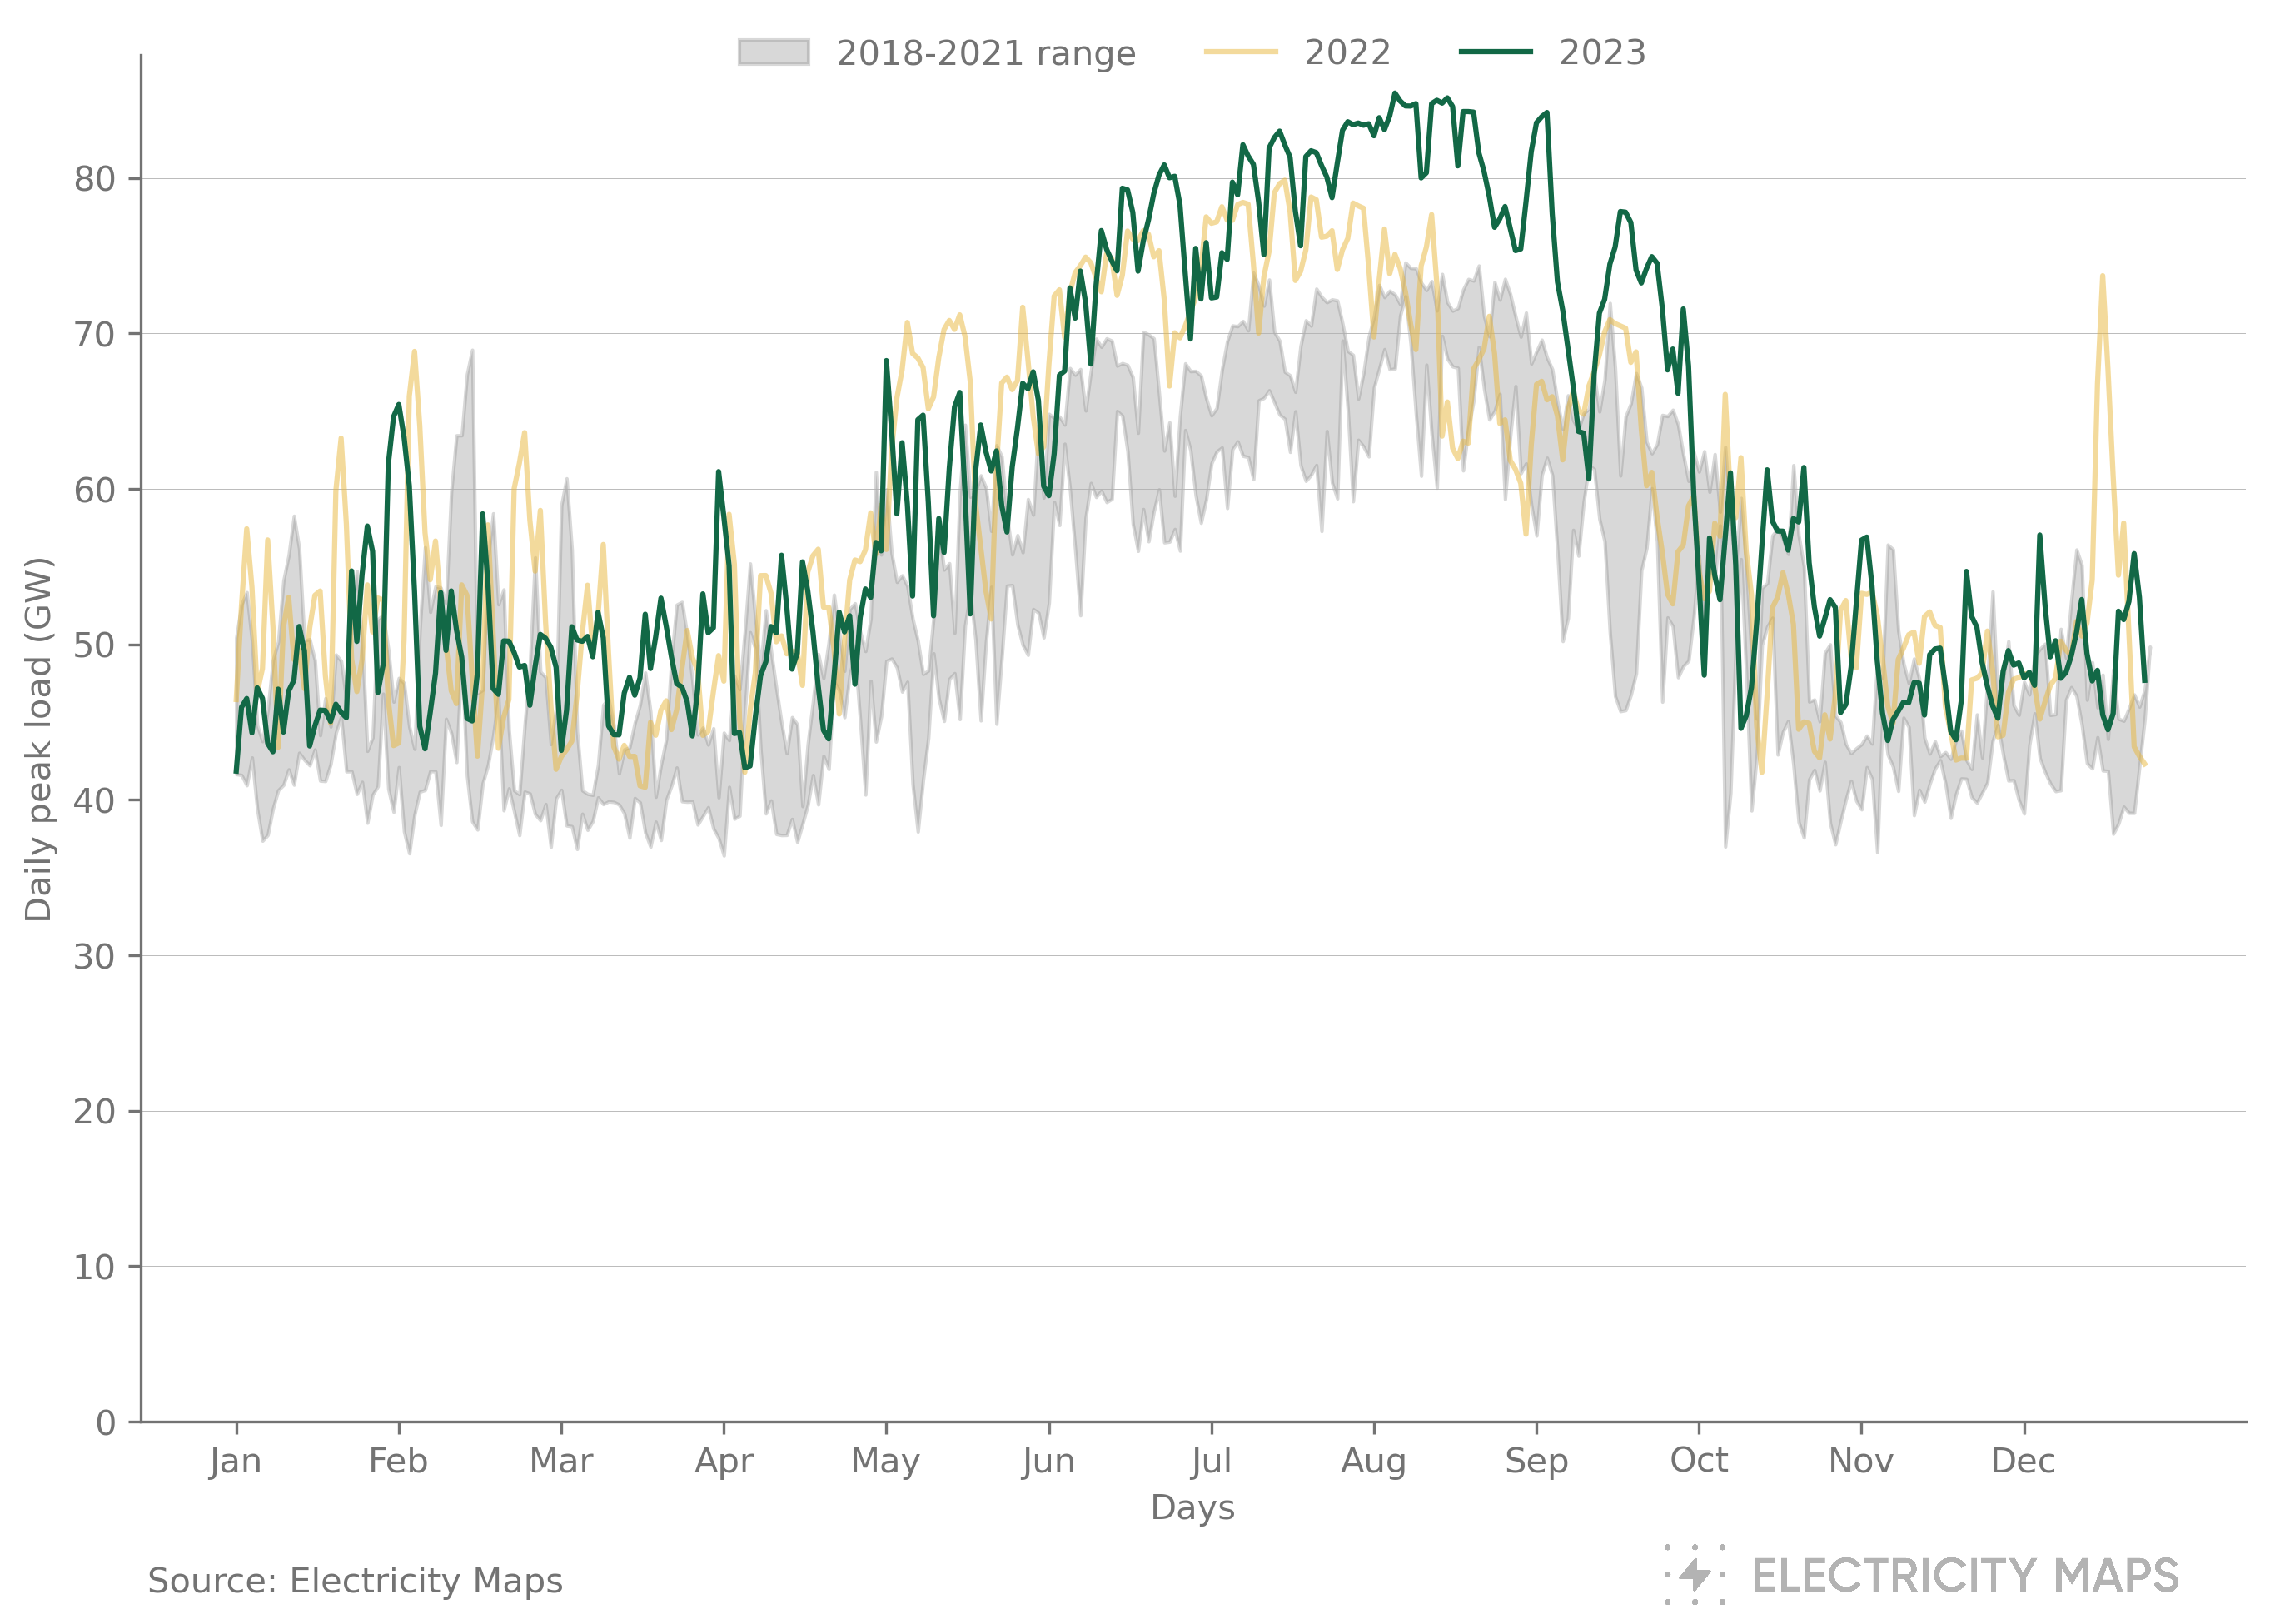
A quick look at the daily peak load (maximum electricity demand in a day) in Central West US between the years helps understand the correlation between weather events and records in electricity demand. Highest peak loads are either observed in the middle of the winter or in the middle of summer. In December 2022, the US was hit by storm Elliott which brought blizzard conditions and freezing temperatures across many regions10. As a consequence of increased heating demand, records of power demand were set as observed above. However, the record daily peak load in a year is usually observed in summer. The overall record in Central West US was broken this year in late August. At the same time, a heat dome brought record-heat conditions across the Plains, Midwest, and South11. Such conditions brought a massive increase in cooling demand and led to a record peak load for the electricity grid.
The daily peak load in Texas also experienced a record high in December 2022. In the summer of 2023, the situation was even more exceptional than observed in Central West US and daily peak load records have been successively broken from June to September. Texas has experienced much higher than average temperatures all summer long11 and set a record daily peak load of 85.5 GW against a previous record of 79.8 GW in 2022. Such an increase in peak load poses some challenges for the Texan power grid which might only amplify in coming years with climate change.
Electricity demand slightly decreased in the US in 2023 with slowing economic growth but remained above levels of 2020 and 2021. While solar generation kept increasing it only represents less than 4% of US electricity production. On the other hand, wind generation represents more than 10% of total US electricity production but its generation decreased compared to 2022 with lower wind speeds experienced throughout the country in Spring.
The US grid continued its transition from coal to gas but overall maintained the same production level for all fossil fuels combined since 2018. The dependence of the US grid on fossil fuel-fired generation is especially marked during extreme weather events such as heatwaves and cold snaps, and such events are expected to be reinforced in the coming years.
Of all US regions, California is at the forefront of grid decarbonization with more than 20% of its electricity generated from solar and massive developments in battery storage. Texas is bridging the gap with an impressive increase in both solar and wind generation across the last four years. With such development speed in variable renewables production, the US could generate more electricity from wind and solar than coal in 2024 which would be a first milestone in its long grid decarbonization journey.

1 Electricity Market Report – Update 2023 – Analysis - IEA
2 Summary of Inflation Reduction Act provisions related to renewable energy | US EPA
3 U.S. May 2023 Wind Speeds Below Normal Due to -SOI - Climate Impact Company
4 US wind power generation breaks out of summer doldrums | Reuters
7 Short-Term Energy Outlook - U.S. Energy Information Administration (EIA)
8 Summary of Inflation Reduction Act provisions related to renewable energy | US EPA
10 Electricity Maps - Blogpost: Weather events & carbon emissions

